How the Coronavirus Response Is Aided by Analytics
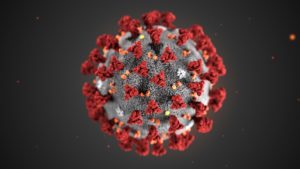
The rapid emergence and spread of the novel coronavirus, 2019-nCoV, has alarmed people around the world. While the possibility of a global pandemic is real, people can take some solace in the fact that public health officials have at their disposal an array of powerful data collection and analytics techniques that previous generations lacked.
2019-nCoV may be the most closely watched virus in the world at the moment. The virus, which causes a pneumonia-like illness that’s quite similar to the Severe Acute Respiratory Syndrome (SARS) outbreak 2003 that killed 800 people, appears to have jumped into the human biome at an exotic meat market in Wuhan, China, where delicacies like bats and snakes were sold to the public.
But what makes 2019-nCoV dangerous is its ability to spread from human to human, and that’s how more than 17,000 Chinese citizens have gotten sick. However, before Chinese authorities could quarantine Wuhan and surrounding areas, infected individuals were allowed to travel around the world, and today individuals in 20 countries have been reported to be infected with 2019-nCoV, which the World Health Organization (WHO) last week declared a global health emergency.
Today, public health officials around the world are using an array of data analytic tools to battle this outbreak, including tracking where 2019-nCoV has already spread, how it’s spreading, and forecasting where it’s going next.
Public health officials not only have more tools available to them today than they did in the past, but they have more data, according to Theresa Do, a biostatistician at SAS, a developer of analytics software.
“There’s a lot of different data sources coming in and we’re leveraging a lot more sentinel data sources these days,” Do says. “We’re able to stream data in a lot faster.”
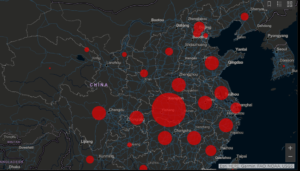
The Johns Hopkins CSEE is tracking novel coronavirus here.
The first step in documenting a new infection of 2019-nCoV or other disease is largely a manual effort and hasn’t changed. Case workers go out into the field and take notes with a pen and paper — hopefully while wearing a mask and gloves too. That first step, which is critical to get the count, hasn’t changed much.
But once a new case of an illness like 2019-nCoV is reported, the data quickly spreads and technicians can bring their other resources to bear, such as software from SAS and other vendors. The technicians may combine various pieces of data, such as a case report and perhaps a flight manifest, to get a better picture of how the illness is spreading, according to Do, who previously worked in the Department of Defense’s Global Health Surveillance program.
“We can get at those answers a lot faster and then build predictive models around it and then maybe do some scenario analysis to kind of war game and figure out where it’s going to spread and what that might look like,” she tells Datanami.
Geographic information systems (GIS) are important in tracking how viruses like 2019-nCoV are spreading through space and time. The Johns Hopkins Center for Systems Science and Engineering (CSSE) is hosting a real-time GIS dashboard based on Esri’s ArcGIS showing all documented cases of 2019-nCoV around the world. You can assume that the decision makers at the Centers for Disease Control (CDC), WHO, and Global Health Surveillance have even better interfaces.
Besides field reports, there are other ways to infer illness at the population level, including mining social media and news websites. One resources is www.healthmap.org, a website that tracks mentions of public health incidents around the world. John Brownstein, a computational epidemiologist who runs the healthmap.com site, says there’s a lot more data available now.
“During SARS, there was not a huge amount of information coming out of China,” Brownstein tells STAT News. ”Now, we’re constantly mining news and social media.”
After identifying a new case of infection, public health officials will work with the person to retrace their steps to determine who else they may have come in contact with. This is a difficult, time-consuming task, but it could be made easier using modern technology.
Dilip Sarangan, global research director for the IoT at Frost & Sullivan, foresees a “a network of virus-detection sensors” that use facial recognition to “to identify, trace, and monitor people that may have contracted the coronavirus.”
Such a system could also track every individual that an infected patient contacted. “While this may sound like a police state to many, ultimately, leveraging IoT and AI may be the most logical way to prevent highly infectious diseases from spreading rapidly in a world that is getting smaller every day with air travel,” Sarangan says.
Following the SARS outbreak, a frontline healthcare doctor named Kamran Khan set out to build a system that could automatically collect and analyze huge amounts of publicly available to detect the spread of infectious disease. Khan, who today is a professor of medicine and public health at the University of Toronto, built that infectious disease surveillance system and sells access to it through his company, BlueDot.
Today BlueDot is tracking the spread of more than 100 diseases, such as Zika, West Nile, mumps, Lassa Fever, and good old plague around the world. It does this by automatically ingesting public data from more than 10,000 official and mass media sources in 65 languages, processing the text using natural language processing (NLP) and machine learning techniques, and summarizing the findings in a concise manner. “If we did this work manually, we would probably need over a hundred people to do it well,” Khan tells Forbes.
There are also secondary indicators to spotting influenza outbreaks. While Google Flu Trends never quite panned out, mining social media and other personal information for signs of widespread illness is feasible, SAS’s Do says. That could include scraping Internet-connected devices like smart watches to detect elevated temperatures in people or spotting abnormal episodes of Netflix binge-watching.
“There might be other indicators we can leverage as try to get ahead of a lot of these viruses and things that may come in the future,” Do says. Of course, customers would need to be assured that their data is not being violated, she says. But if that could be solved, there’s a wealth of data that could be mined to help the public health “The technology is definitely there,” she adds.
Predicting where 2019-nCoV will spread next is important because it lets government decision-makers allocate limited resources more effectively. That could mean increasing the staffing level of doctors and nurses to accommodate a surge in 2019-nCoV patients, or even adapting supply chains to ensure an adequate supply of protective clothing, like the all-important N95 surgical mask, which has apparently sold out across the entire world. The Chinese government took the extraordinary step of building an entirely new hospital in less than two weeks just to handle for 2019-nCoV patients.
When planning for an event like the 2019-nCoV outbreak, it’s important to take into account how secondary effects could play out, Do says. “In China there are thousands that are sick, so I think they are inundating the system,” she says. “Not only are people going to, say, expire due to the virus, but there could be other complications of other people with other ailments that are not able to be treated, just because the hospitals are at capacity.”
Related Items:
Hunting Down Ebola with Big Data
Using Wiki-data to Monitor, Forecast Disease Outbreaks
Mining Twitter Data for Disease Risk
