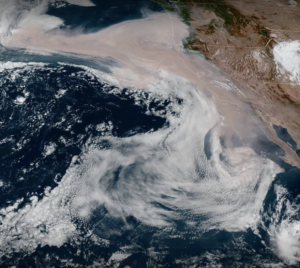
Graphing West Coast Days of Darkness

Source: North Callahan
These are dark days for residents of the U.S. Pacific Coast—literally.
According to the New York Times, the Bear Fire near Oroville, Calif., “jumped an astonishing 230,000 acres overnight” between September 8 and 9, darkening the daytime skies over San Francisco and other large west coast cities.
The scale of the devastation wrought by wildfires in the western U.S. is beyond human comprehension, prompting one Bay Area citizen data scientist to attempt to gauge the impact.
In a Facebook post, Jeremy Cooper of San Francisco measured and graphed the amount of sunshine during the darkest day of the wildfire fallout this week.
Normally, fogless San Francisco receives about 800 watts per square meter of sunlight at solar noon. (Across the Bay, the stadium where Major League Baseball’s Oakland A’s play, is known for its “high sky.”)
On Sept. 9, Cooper measured a maximum of 22 square meters of sunlight in San Francisco.
Hence, the Mars-like pall cast by wildfires raging east of the City by The Bay.
“It is really hard to convey just how unusual September [9], 2020—the day without sunshine—was for San Francisco,” Cooper noted in his post. “Here’s some data in the form of a graph”:
There are more dark days ahead: On Friday (Sept. 11) the mayor of Portland, Oregon, ordered an evacuation as wildfires burned through the city’s suburbs. According to one Portland resident. “This whole area has been completely covered in smoke and ash for days. The sun is currently blotted out.
“When we do see it, it’s dull and orange.”
Recent items:
AI Startup Aims to Extinguish Wildfires
IBM, Microsoft, Nvidia Pit AI Against Wildfires
Seeing the Forest For the Trees With Analytics


